Welcome!
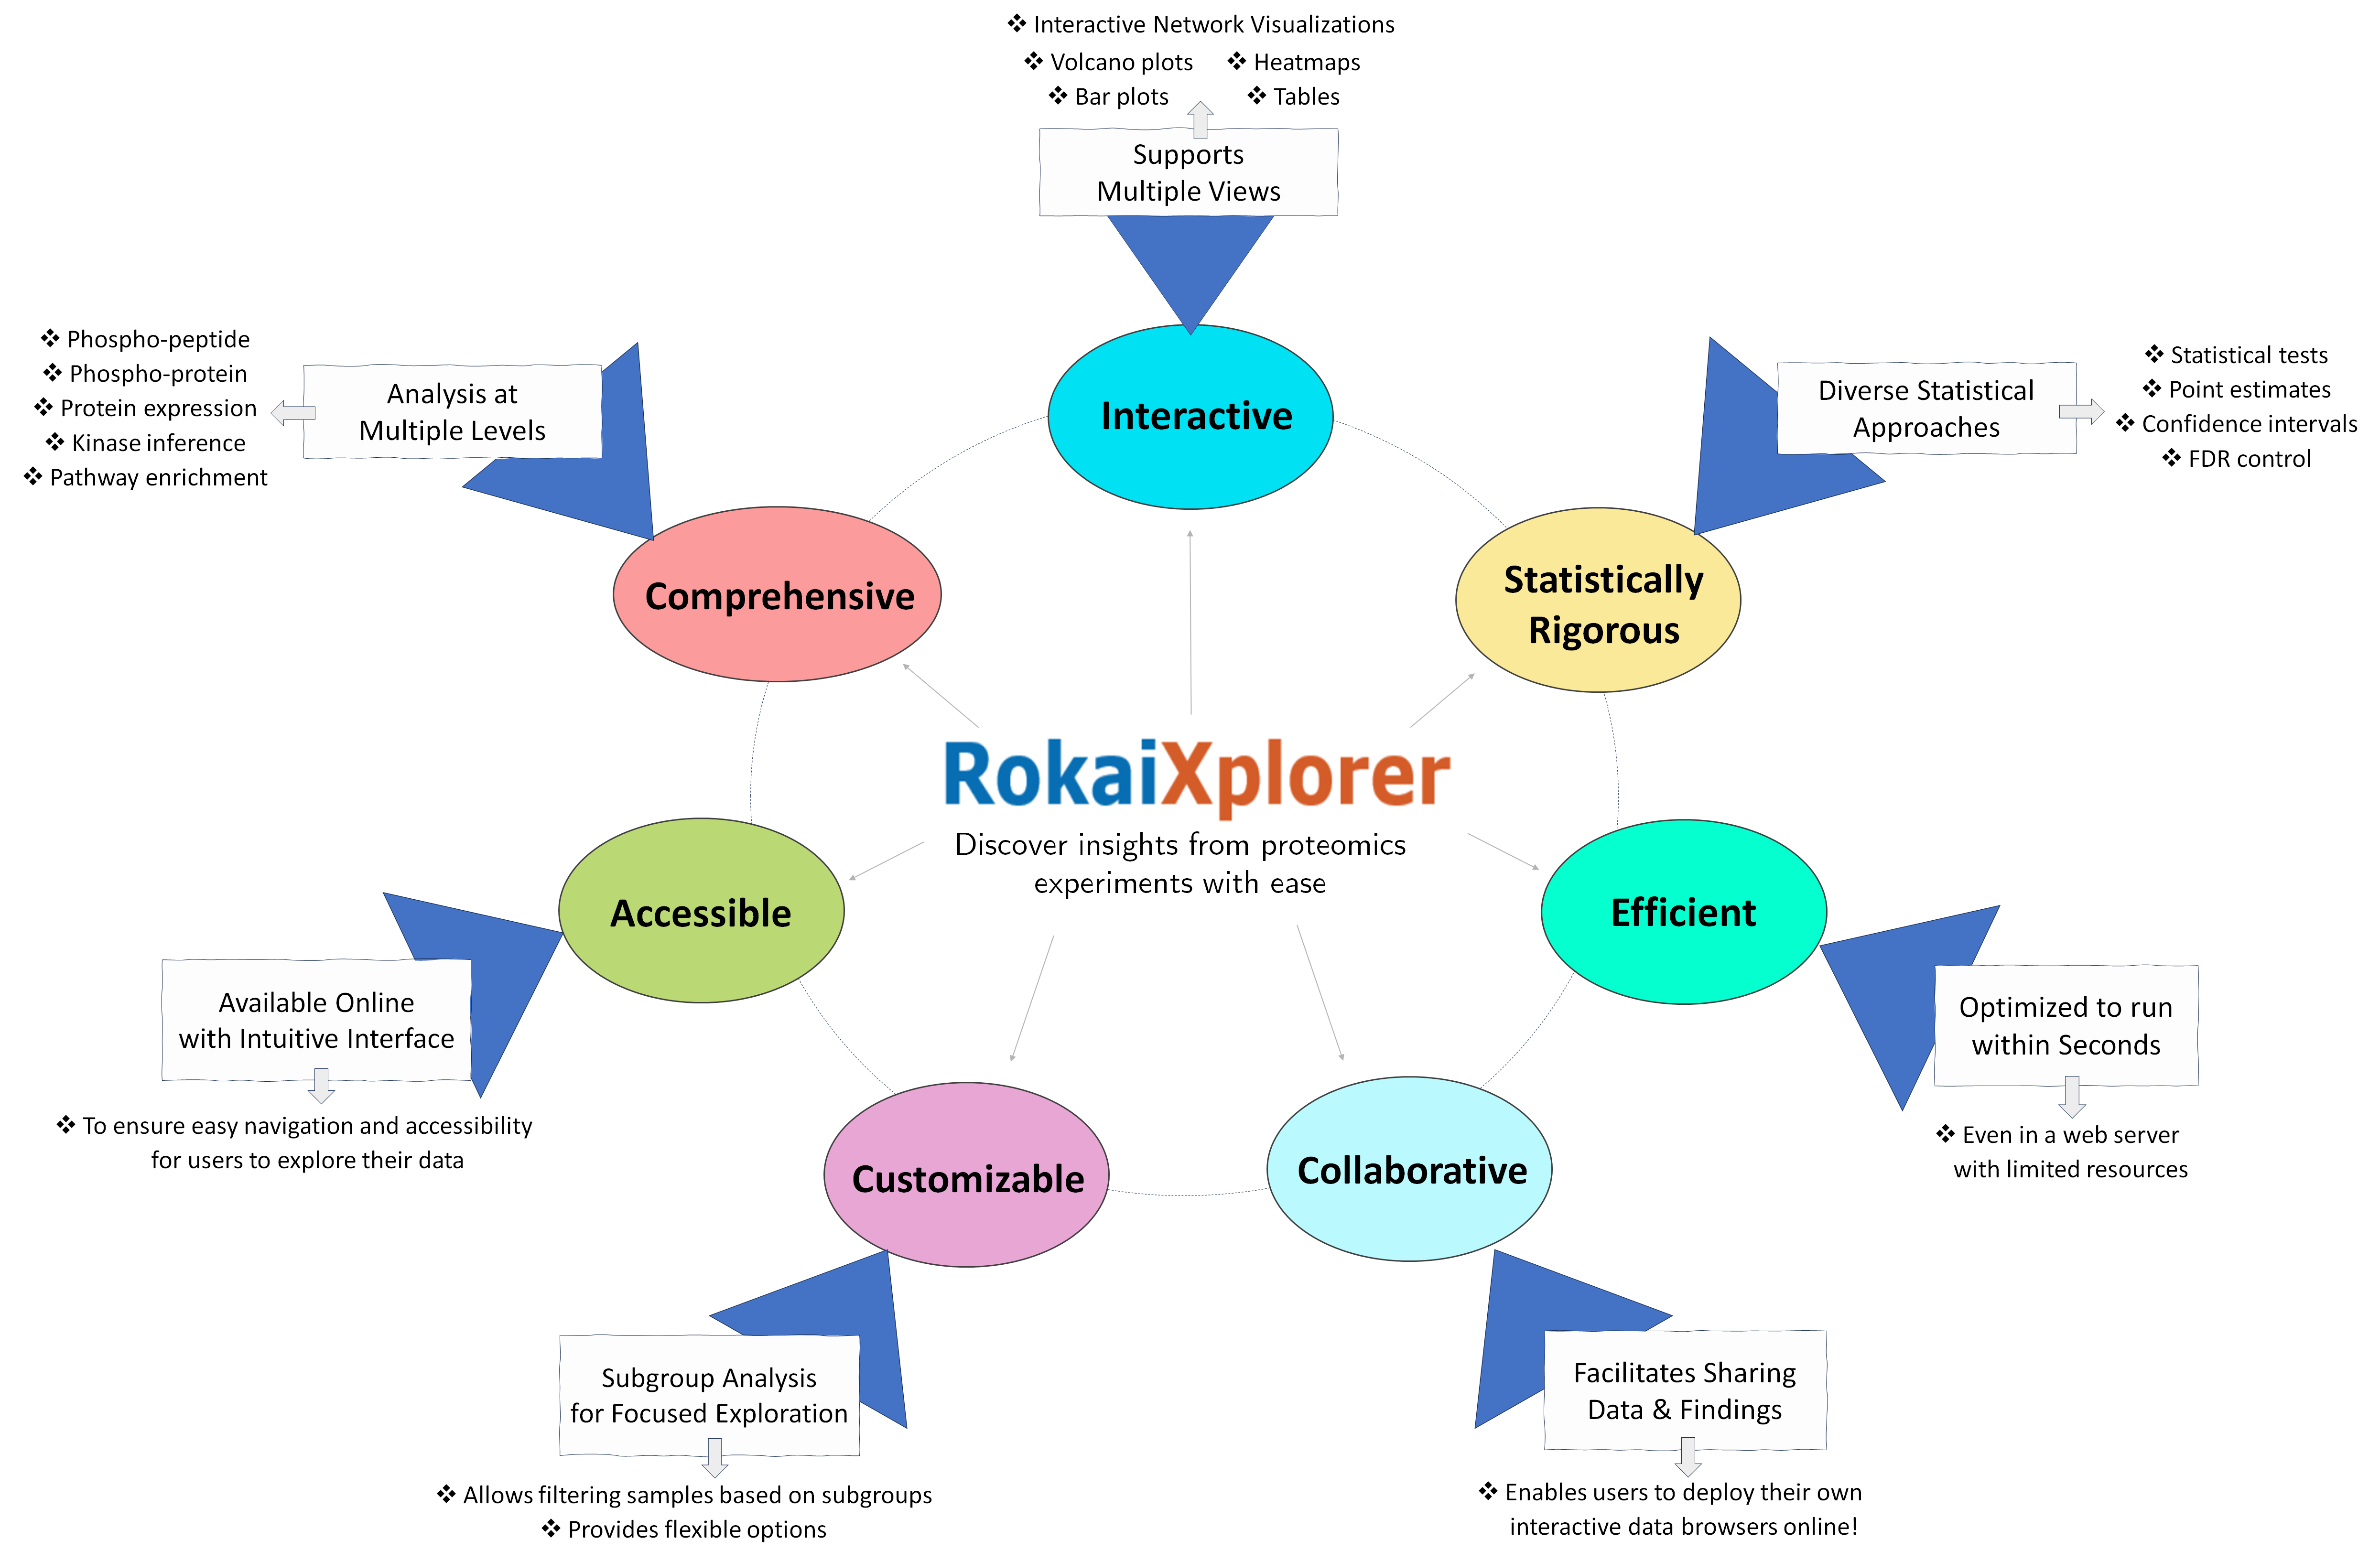
RokaiXplorer is an interactive tool designed for exploratory data analysis of proteomics and phospho-proteomics data to uncover novel biomarkers and potential clinical targets.
With RokaiXplorer, you can:
- Identify significant changes in phosphorylation and protein expression with ease,
- Perform enrichment analysis of gene ontology (GO) terms to gain insights,
- Infer kinase activities using the RoKAI algorithm.
Thank you for using RokaiXplorer!
Contact
Giving feedback
References
-
Yilmaz, S., Lopes, F. B. T. P., Schlatzer, D., Ayati, M., Chance, M. R., & Koyuturk, M. (2024) Making Proteomics Accessible: RokaiXplorer for interactive analysis of phospho-proteomic data. Bioinformatics Advancesvbae077
-
Yilmaz S., Ayati M., Schlatzer D., Cicek A. E., Chance M. R., Koyuturk M. (2021) Robust inference of kinase activity using functional networks Nature Communications12 (1117)
-
Hornbeck, P. V. et al. (2015) Phosphositeplus, 2014: mutations, ptms and recalibrations. Nucleic acids research43(D1), D512-D520
-
Licata, L. et al. (2020) SIGNOR 2.0, the SIGnaling network open resource 2.0: 2019 update. Nucleic acids research48(D1), D504-D510
-
Minguez, P. et al. (2012) PTMcode: a database of known and predicted functional associations between post-translational modifications in proteins. Nucleic acids research41(D1), D306-D311
-
Szklarczyk, D. et al. (2014) STRING v10: protein–protein interaction networks, integrated over the tree of life. Nucleic acids research43(D1), D447-D452
-
Damle, N. P., & Köhn, M. (2019) The human DEPhOsphorylation Database DEPOD: 2019 update. Database
-
The Gene Ontology resource: enriching a GOld mine (2021) Nucleic acids research 49.D1: D325-D334
Dataset Versions
Share Your Data and Results Online with RokaiXplorer
Starting from v0.5.0, RokaiXplorer now allows you to easily share your datasets and analysis results online through an interactive data browser. Explore some examples below:
- ExampleApp
- ADXplorer (an application on Alzheimer’s disease data)
To deploy your own application, you will need:
- The provided scripts from our Github page
- R, RStudio, and Rtools (for Windows) installed on your system
- Your data, metadata and expression data (if applicable) to be used in your application
- An optional configuration file that can be generated from the
Import/Export Configtab - A markdown
.mdfile to display descriptions in theAboutsection - A Shinyapps.io account to deploy your application online (which you can create for free)
For a detailed tutorial on deployment, please visit our Github page.
Plot Options
Analysis Options
This network is interactive! You can drag & drop nodes to adjust the view and hover to see more information. Double click on a node to inspect it in detail.
Plot Options
Analysis Options
This network is interactive! You can drag & drop nodes to adjust the view and hover to see more information. Double click on a node to inspect it in detail.
Plot Options
Analysis Options
Plot Options
Analysis Options
Filtering Options
Inclusion Criteria (Enrichment Terms)
Number of terms:
Gene List for Enrichment
Number of proteins: